Dmitry Mazin
"cyberdemon.org is a cool domain"
home / email me / bluesky / mastodon / RSS feed / Telegram channel
Lab Notes: A Whole Lot About Disks and File Systems
A warning: this lab is particularly long. However, it’s also the best example to date of what I’m trying to do with these: instead of presenting a tidy narrative, I am showing you my thought process almost entirely, including many dead ends, and much, much confusion.
This week, instead of posting daily lab notes I’ve been working silently. I’ve still been taking notes, but have taken less care to make them presentable. My idea has been that instead of posting daily lab notes, which are unlikely to be interesting, I ought to just finish up whatever thing I’m investigating, and then put together a polished narrative. It’s still not clear to me what the right approach is. Today, I think I will try a hybrid: the lab notes will cover only what I worked on today (and so, if I find motivation, I should be able to publish a new lab note daily), but I will polish the narrative a bit. (Record scratch: I didn’t!)
When I’m done investigating this, I plan on writing a polished article, with a direct narrative, that I hope will be more broadly interesting than my lab notes.
Anyway, to recap, for days now I’ve been investigating why sysbench’s reported random write throughput is lower than the disk throughput reported by the Linux kernel (reported via sar and iostat, that is).
Earlier this week, I looked into exactly how sysbench calculates its throughput to understand how it works, and to see if there is maybe some bug. But, no, I do not think there is any bug at all. sysbench properly calculates exactly how much it writes, and then divides that by the runtime to calculate the throughput. (I will explain this in more detail in the final article. Here, I just want to recap what I’ve been doing).
Then, I had a hunch: what if disks have a minimum “write unit”, so that if you request a 16 KB write, they will still write 128 KB (for example), because they cannot write less than 128 KB at a time. To test this, I started playing with sysbench’s chunk size parameter, which controls how many bytes at a time sysbench writes. My hypothesis was that, if the sysbench chunk size is smaller than the disk “write unit”, then if I double, or halve, the chunk size, I should not see significant change in the disk throughput. Indeed, this is what I found!
At this point, I realized that things would make a lot more sense to me if I understood the fundamentals better. To understand the fundamentals, I picked up an excellent book by Brendan Gregg, System Performance (2nd edition). Gregg takes an excellent approach to teaching performance engineering: first, he explains the fundamentals, then he explains how to observe whatever it is you want to diagnose or tune (e.g. disk performance), and then he explains how to tune it.
Reading Gregg, I learned that there are two systems I need to understand in order to understand what is going on during the sysbench benchmark. Obviously, there is the disk system. I need to understand what is happening on the disk, because it might be buffering writes, etc. Less obviously, I also need to learn about the file system. The file system also does a bunch of stuff, like buffering, before the write request hits the disk.
One thing I learned right away is that there is a distinction between logical writes and physical writes. Logical writes are, for example, pwrite calls, which is the syscall sysbench uses to ask the file system to write to a random file location. Physical writes refer to the disk actually bring written to. The fact that there is a distinction is important: not to give the whole investigation away, but after reading Gregg, it is not surprising to me that sysbench and the kernel are giving me different stats: sysbench is counting logical bytes written, while the kernel is counting the actual bytes written to disk.
At this point, I think I have a good idea for what I want to do next.
- Identify the sub-components/features of the ext4 file system, as well as my SSD, which may account for the discrepancy between sysbench’s reported throughput and disk throughput.
- See if I can tune various parameters to get the two throughputs to match. If I can get them close, it shows that I have properly understood what happens when you try to do a random disk write.
I have almost finished reading the Gregg chapter on file systems. I need to read the bit about tuning, because it may help continue to explain the features and sub-systems of my file system. After that, I will read the chapter on disks.
Ah, actually, the file system chapter has some advice about benchmarking, which I should read before reading about tuning.
Funny enough, Gregg advises that your benchmarking tool may not agree with iostat:
When using these tools, it is a good idea to leave iostat(1) continually running to confirm that the workload reaches the disks as expected, which may mean not at all. For example, when testing a working set size that should easily fit in the file system cache, the expectation with a read workload is 100% cache hits, so iostat(1) should not show substantial disk I/O.
Given what Gregg teaches about the file system, this is not at all surprising. I suppose this would make no sense to you, though, because I have not actually explained any of the features of a file system that may explain the discrepancy. I will leave that for the final article.
When talking about dd, Gregg mentions that a sequential write test performed using dd will not really tell you disk performance so much as file system performance. One reason is that, thanks to write-back caching, the writes may not actually be flushed to disk. Gregg references the vm.dirty_* tunable parameters, which is covered in yet another chapter: memory. I sincerely hope that I will not need to read the memory chapter as part of this entire investigation, though it kind of makes sense. Memory is highly relevant to file systems.
Next, Gregg mentions which benchmarking tools he uses to benchmark file systems. He does mention sysbench, though his recommendation is to use fio as it more accurately simulates real-world access patterns, and, hugely importantly, reports latency percentiles. Perhaps at the end of all this, I will also play with fio. Also, I learned something interesting: the thing I’ve been doing, where I run a benchmarking tool while also monitoring using observability tools, is called “active benchmarking”. Gregg says: “You can confirm that the benchmark tests what it says it tests, and that you understand what that is. […] As a bonus, this can be a good time to develop your skills with performance observability tools.” Indeed.
Ooh, next Gregg teaches about a very useful thing you can do. It’s possible for two consecutive benchmarks to perform differently, because the first ran on a cold cache, and warmed up the cache during the benchmark, while the second benchmark ran against a warm cache. echo 3 > /proc/sys/vm/drop_caches will free the filesystem cache entirely.
In terms of tuning, I’m particularly interested in tuning the file system. For example, perhaps I can tune the record size? One thing you can tune is that you can turn off some metadata updates via your mount options. For example, you can set noatime to avoid changing the access times. This might be useful when exploring “when I write 4 KB to disk, how come more than 4 KB gets written?” Anyway, back to record size. When I list filesystem parameters using tune2fs -l <device>, I see that block size is set to 4096.
I am interested in changing the block size, and Gregg does not explain. So I went searching online, and a SO answer mentions that I can get various block device parameters using blockdev and I can change some of them when mounting the filesystem.
Reading the blockdev manpage, I see some interesting parameters it can read.
       --getiomin
           Get minimum I/O size.

       --getioopt
           Get optimal I/O size.

       --getpbsz
           Get physical block (sector) size.

       --getss
           Print logical sector size in bytes - usually 512.

       --getbsz
           Print the blocksize in bytes. This size does not describe device topology. It’s the size used internally by the kernel and it may be modified (for example) by filesystem
           driver on mount.
There is a lot going on here. There is I/O size, physical block size, logical sector size, and block size. What are the values?
$ sudo blockdev --getiomin --getioopt --getpbsz --getss --getbsz /dev/sda5

4096
0
4096
512
4096
I have no idea what I/O size is, but one of the 4096’s is surely the ext4 block size, and one of them must be the disk sector size. I do not know what the third 4096 is.
I think I am getting a little bit into the weeds. Let’s earmark for later. Later, I will want to play with creating a new filesystem later with a different block size, which I can do with mkfs -t ext4 -b 4096 <device>.
This wraps up the chapter on file systems. Though, I did not read much about file system observability tools. I may come back to that section after reading about disk observability tools. I’d like to be able to tell which tools tell you about the disk and which tell you about the file system.
Now, I am going to read the chapter on disks.
One thing I see right away: disks have internal queues. In computing, queues are everywhere (this is one concept I want to write about sometime).
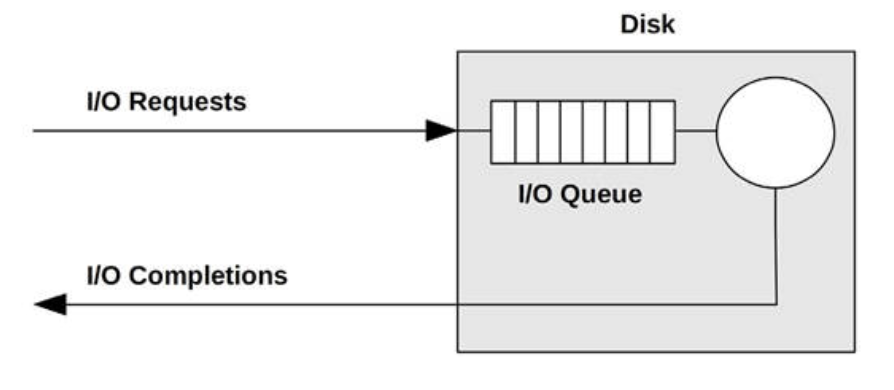
Another interesting thing: a disk may have an internal cache, used not only for reads, but also writes (in which case we’d call it a write buffer). It is possible for a disk to tell the kernel the write succeeded once it has reached the write buffer. This is fine, apparently, because such a cache would have batteries meaning that the write can be finished later.
Gregg goes on to discuss the intricacies of disk timing in detail. For example, the difference between “block I/O wait time” and “disk wait time”. I am interested in timing things, but not right now, so I am mostly glossing over this.
Ah, OK, here we go, Gregg is explaining what I/O sizes are. The I/O size is a characteristic of your workload. That is, it’s not something you set directly. For example, you could plot the distribution of I/O sizes for your workload, and determine if it’s most efficient or not. I/O size is affected by things like the disk sector size, so, for example, if you do a bunch of 1-byte writes, the average I/O size may be 512 bytes (because the disk sector size, in this instance, is 512 bytes). There is an optimal I/O size for your system, which may be documented, but can be found by benchmarking. So, for example, I could tune the sysbench parameters (e.g. chunk size) to get maximum performance out of it. I could use this information to inform decisions, e.g. database index page size.
Welp, my brain is saturated. I don’t think I can read any more. Now I’m going to show you some cool stuff.
Yesterday, I looked at the source code for iostat to see where it gets its stats. Turns out, it gets its stats from /sys, which is a file-based interface that Linux uses to expose information about your system. iostat looks at a few files, but most notably it looks at /sys/dev/block/<major>:<minor>/stat to get disk stats about a particular partition.
One reason I looked into how iostat works was because I was comparing it to how sysbench works. I was hoping that I would find a discrepancy. And, indeed, I did: sysbench measures the size of its logical writes, while iostat, via /sys/dev/block/<major>:<minor>/stat, counts how much was actually written to disk.
Now that I knew I could access /sys/dev/block/<major>:<minor>/stat to get disk stats directly, I was able to make myself a tool that I’ve been wanting. While iostat gives me periodic measurements, and sar can print averages at the end of its run (I’m 99% sure sar also looks at /sys), I wanted a tool that told me exactly how much the stats changed between two points in time.
And so I wrote a Python script called disk_stat_diff to do so. I’ll quote its README:
This is a small Python script that can be invoked multiple times. Each time you invoke it, it tells you how much various disk statistics for a given partition have changed since the last invocation.
Using disk_staff_diff, I can show you something cool.
Remember when we were talking about how a 1 byte logical write does not necessarily mean that we will actually write exactly 1 byte to disk? Well, check this out.
I’m going to run disk_stat_diff back-to-back with dd to see exactly how many bytes were copied during the dd operation.
python3 disk_stat_diff.py sda5
dd if=/dev/zero of=/data/foo bs=1 count=1
python3 disk_stat_diff.py sda5
dd output:
1+0 records in
1+0 records out
1 byte copied, 0.000146355 s, 6.8 kB/s
disk_stat_diff output:
Difference over the past 0.02 second(s).
------------------------------------
| stat            | diff | avg       |
------------------------------------
| read_ios        |    0 |       0.0 |
| read_merges     |    0 |       0.0 |
| read_sectors    |    0 |       0.0 |
| read_ticks      |    0 |       0.0 |
| write_ios       |    1 |     42.34 |
| write_merges    |    0 |       0.0 |
| write_sectors   |    8 |    338.76 |
| write_ticks     |    0 |       0.0 |
| in_flight       |    0 |       0.0 |
| io_ticks        |    4 |    169.38 |
| time_in_queue   |    0 |       0.0 |
| discard_ios     |    0 |       0.0 |
| discard_merges  |    0 |       0.0 |
| discard_sectors |    0 |       0.0 |
| discard_ticks   |    0 |       0.0 |
| flush_ios       |    0 |       0.0 |
| flush_ticks     |    0 |       0.0 |
| read_bytes      |    0 |       0.0 |
| write_bytes     | 4096 | 173444.68 |
| discard_bytes   |    0 |       0.0 |
------------------------------------
Do you see? DO YOU SEE? dd copied 1 byte, but disk_stat_diff shows that 4,096 bytes were written to disk!
I think this is because the record size of the ext4 file system mounted to the partition is 4096 bytes. How can I test this?
I will destory the file system and re-mount it with a smaller block size. Then, I’ll run this test again, and see how many bytes actually get copied.
First, let’s unmount the file system: sudo umount /data.
And now let’s make a new file system on its device with a 2048 byte block size.
$ sudo mkfs -t ext4 -L data-ssd /dev/sda5 -b 2048

mke2fs 1.46.5 (30-Dec-2021)
Warning: specified blocksize 2048 is less than device physical sectorsize 4096
/dev/sda5 contains a ext4 filesystem labelled 'data-ssd'
        last mounted on /data on Thu Mar 16 10:19:22 2023
Proceed anyway? (y/N) y
Discarding device blocks: done
Creating filesystem with 8388608 2k blocks and 1048576 inodes
Filesystem UUID: 04f01874-3412-412d-a55d-97f743895296
Superblock backups stored on blocks:
        16384, 49152, 81920, 114688, 147456, 409600, 442368, 802816, 1327104,
        2048000, 3981312, 5619712

Allocating group tables: done
Writing inode tables: done
Creating journal (65536 blocks): done
Writing superblocks and filesystem accounting information: done
Oh, this is interesting: Warning: specified blocksize 2048 is less than device physical sectorsize 4096. That means that actually, we should not expect to see fewer than 4096 bytes written at once. That said, it shows that the sector size is 4096 bytes, which I wasn’t sure about before.
Let’s run the 2048 byte experiment anyway, but now that we know that the sector size is 4096 bytes, then a more interesting experiment would be to double the block size to 8192 bytes.
Well, that’s interesting.
$ python3 disk_stat_diff.py sda5
$ dd if=/dev/zero of=/data/foo bs=1 count=1
$ python3 disk_stat_diff.py sda5

1+0 records in
1+0 records out
1 byte copied, 0.000168328 s, 5.9 kB/s

Difference over the past 0.02 second(s).
-----------------------------------
| stat            | diff | avg      |
-----------------------------------
| read_ios        |    0 |      0.0 |
| read_merges     |    0 |      0.0 |
| read_sectors    |    0 |      0.0 |
| read_ticks      |    0 |      0.0 |
| write_ios       |    1 |    40.99 |
| write_merges    |    0 |      0.0 |
| write_sectors   |    4 |   163.96 |
| write_ticks     |    0 |      0.0 |
| in_flight       |    0 |      0.0 |
| io_ticks        |    4 |   163.96 |
| time_in_queue   |    0 |      0.0 |
| discard_ios     |    0 |      0.0 |
| discard_merges  |    0 |      0.0 |
| discard_sectors |    0 |      0.0 |
| discard_ticks   |    0 |      0.0 |
| flush_ios       |    0 |      0.0 |
| flush_ticks     |    0 |      0.0 |
| read_bytes      |    0 |      0.0 |
| write_bytes     | 2048 | 83950.03 |
| discard_bytes   |    0 |      0.0 |
-----------------------------------
Actually, it did write 2048 bytes, even though the disk sector size is said to be more than that.
So, here is where I can leverage a little bit of what I’ve learned from Gregg.
I think what’s happening is that, first, the write is added to the disk’s cache. Even if the disk sector size is 4096 bytes (i.e. it’s impossible to write fewer than 4096 bytes at a time), it’s possible to write just 2048 bytes to the disk cache. But, the actual disk write is much bigger. It’s just not reflected in this.
Let me show you something. What I’m going to do now is:
python3 disk_stat_diff.py sda5
dd if=/dev/zero of=/data/foo bs=1 count=1
sleep 30
python3 disk_stat_diff.py sda5
sleep 30
python3 disk_stat_diff.py sda5
That is, write using dd, but then wait 30s, long enough for the disk to potentially flush its cache. Then, see how much data was written.
1+0 records in
1+0 records out
1 byte copied, 0.000168204 s, 5.9 kB/s
Difference over the past 30.03 second(s).

---------------------------------
| stat            | diff  | avg   |
---------------------------------
| read_ios        |     0 |   0.0 |
| read_merges     |     0 |   0.0 |
| read_sectors    |     0 |   0.0 |
| read_ticks      |     0 |   0.0 |
| write_ios       |     6 |   0.2 |
| write_merges    |     5 |  0.17 |
| write_sectors   |    44 |  1.47 |
| write_ticks     |     4 |  0.13 |
| in_flight       |     0 |   0.0 |
| io_ticks        |    12 |   0.4 |
| time_in_queue   |     5 |  0.17 |
| discard_ios     |     0 |   0.0 |
| discard_merges  |     0 |   0.0 |
| discard_sectors |     0 |   0.0 |
| discard_ticks   |     0 |   0.0 |
| flush_ios       |     0 |   0.0 |
| flush_ticks     |     0 |   0.0 |
| read_bytes      |     0 |   0.0 |
| write_bytes     | 22528 | 750.2 |
| discard_bytes   |     0 |   0.0 |
---------------------------------
Aha! We actually wrote WAY more than 2048 bytes.
After waiting another 30s, we run disk_stat_diff again:
Difference over the past 30.03 second(s).
------------------------------
| stat            | diff | avg |
------------------------------
| read_ios        |    0 | 0.0 |
| read_merges     |    0 | 0.0 |
| read_sectors    |    0 | 0.0 |
| read_ticks      |    0 | 0.0 |
| write_ios       |    0 | 0.0 |
| write_merges    |    0 | 0.0 |
| write_sectors   |    0 | 0.0 |
| write_ticks     |    0 | 0.0 |
| in_flight       |    0 | 0.0 |
| io_ticks        |    0 | 0.0 |
| time_in_queue   |    0 | 0.0 |
| discard_ios     |    0 | 0.0 |
| discard_merges  |    0 | 0.0 |
| discard_sectors |    0 | 0.0 |
| discard_ticks   |    0 | 0.0 |
| flush_ios       |    0 | 0.0 |
| flush_ticks     |    0 | 0.0 |
| read_bytes      |    0 | 0.0 |
| write_bytes     |    0 | 0.0 |
| discard_bytes   |    0 | 0.0 |
------------------------------
The only reason I’m showing you this last thing is just to show that we are the only ones writing to the disk: the entire 22528 bytes written above are the result of our 1-byte write.
Now, I want to understand if disk_stat_diff is initially telling us we wrote 2048 bytes because of the filesystem cache, or the disk cache.
First, let’s skip the file system write buffer. We can do so using the O_DIRECT file mode, which can be enabled in dd via oflag=direct.
Interestingly, you cannot try to write fewer than 512 bytes with oflag=direct:
$ dd if=/dev/zero of=/data/foo bs=1 count=1 oflag=direct
dd: error writing '/data/foo': Invalid argument
Alright, fine, we’ll do 512 bytes.
Interesting. It still spits out 2048 bytes. Since the file system cache is skipped, I think that means that the 2048 byte write is not a reflection of us merely putting the data into the file system cache.
1+0 records in
1+0 records out
512 bytes copied, 0.00403568 s, 127 kB/s

Difference over the past 0.03 second(s).
-----------------------------------
| stat            | diff | avg      |
-----------------------------------
| read_ios        |    0 |      0.0 |
| read_merges     |    0 |      0.0 |
| read_sectors    |    0 |      0.0 |
| read_ticks      |    0 |      0.0 |
| write_ios       |    1 |    37.47 |
| write_merges    |    1 |    37.47 |
| write_sectors   |    4 |   149.87 |
| write_ticks     |    3 |   112.41 |
| in_flight       |    0 |      0.0 |
| io_ticks        |    8 |   299.75 |
| time_in_queue   |    4 |   149.87 |
| discard_ios     |    0 |      0.0 |
| discard_merges  |    0 |      0.0 |
| discard_sectors |    0 |      0.0 |
| discard_ticks   |    0 |      0.0 |
| flush_ios       |    0 |      0.0 |
| flush_ticks     |    0 |      0.0 |
| read_bytes      |    0 |      0.0 |
| write_bytes     | 2048 | 76735.58 |
| discard_bytes   |    0 |      0.0 |
-----------------------------------
Let’s try one more thing. Let’s try oflag=dsync. dd should not return until the disk system has accepted the write. I expect the results to be identical to before, as we were bypassing the filesystem cache then, and we are bypassing it now.
1+0 records in
1+0 records out
512 bytes copied, 0.00522609 s, 98.0 kB/s

Difference over the past 0.03 second(s).
-------------------------------------
| stat            | diff  | avg       |
-------------------------------------
| read_ios        |     0 |       0.0 |
| read_merges     |     0 |       0.0 |
| read_sectors    |     0 |       0.0 |
| read_ticks      |     0 |       0.0 |
| write_ios       |     3 |     93.44 |
| write_merges    |     4 |    124.58 |
| write_sectors   |    28 |    872.06 |
| write_ticks     |     5 |    155.73 |
| in_flight       |     0 |       0.0 |
| io_ticks        |    12 |    373.74 |
| time_in_queue   |     4 |    124.58 |
| discard_ios     |     0 |       0.0 |
| discard_merges  |     0 |       0.0 |
| discard_sectors |     0 |       0.0 |
| discard_ticks   |     0 |       0.0 |
| flush_ios       |     0 |       0.0 |
| flush_ticks     |     0 |       0.0 |
| read_bytes      |     0 |       0.0 |
| write_bytes     | 14336 | 446495.45 |
| discard_bytes   |     0 |       0.0 |
-------------------------------------
30 seconds later:
Difference over the past 30.03 second(s).
--------------------------------
| stat            | diff | avg   |
--------------------------------
| read_ios        |    0 |   0.0 |
| read_merges     |    0 |   0.0 |
| read_sectors    |    0 |   0.0 |
| read_ticks      |    0 |   0.0 |
| write_ios       |    3 |   0.1 |
| write_merges    |    1 |  0.03 |
| write_sectors   |   16 |  0.53 |
| write_ticks     |    2 |  0.07 |
| in_flight       |    0 |   0.0 |
| io_ticks        |    4 |  0.13 |
| time_in_queue   |    2 |  0.07 |
| discard_ios     |    0 |   0.0 |
| discard_merges  |    0 |   0.0 |
| discard_sectors |    0 |   0.0 |
| discard_ticks   |    0 |   0.0 |
| flush_ios       |    0 |   0.0 |
| flush_ticks     |    0 |   0.0 |
| read_bytes      |    0 |   0.0 |
| write_bytes     | 8192 | 272.8 |
| discard_bytes   |    0 |   0.0 |
--------------------------------
So, that’s interesting. Actually, the result was different! Right away, we reported writing 14336 bytes. 30 seconds later, we reported writing 8192. The total (22528 bytes) is the same as before.
First, let’s figure out where the 8192 is coming from. I think it’s metadata, like file access time. According to the dd manpage, if we use oflag=sync, we will wait for the metadata to be committed to disk before dd exits.
Hmm, no, the result is the same. According to Gregg, O_SYNC and O_DSYNC should be the same anyway. Let’s try remounting the filesystem with file access metadata disabled.
Let’s remount the partition with noatime: sudo mount -t ext4 LABEL=data-ssd /data -o remount,noatime.
Hmmm, no. Same thing.
1+0 records in
1+0 records out
512 bytes copied, 0.0132522 s, 38.6 kB/s
Difference over the past 0.04 second(s).

-------------------------------------
| stat            | diff  | avg       |
-------------------------------------
| read_ios        |     0 |       0.0 |
| read_merges     |     0 |       0.0 |
| read_sectors    |     0 |       0.0 |
| read_ticks      |     0 |       0.0 |
| write_ios       |     3 |     76.36 |
| write_merges    |     4 |    101.81 |
| write_sectors   |    28 |     712.7 |
| write_ticks     |    13 |     330.9 |
| in_flight       |     0 |       0.0 |
| io_ticks        |    16 |    407.26 |
| time_in_queue   |    13 |     330.9 |
| discard_ios     |     0 |       0.0 |
| discard_merges  |     0 |       0.0 |
| discard_sectors |     0 |       0.0 |
| discard_ticks   |     0 |       0.0 |
| flush_ios       |     0 |       0.0 |
| flush_ticks     |     0 |       0.0 |
| read_bytes      |     0 |       0.0 |
| write_bytes     | 14336 | 364901.37 |
| discard_bytes   |     0 |       0.0 |
-------------------------------------

Difference over the past 30.03 second(s).
---------------------------------
| stat            | diff | avg    |
---------------------------------
| read_ios        |    0 |    0.0 |
| read_merges     |    0 |    0.0 |
| read_sectors    |    0 |    0.0 |
| read_ticks      |    0 |    0.0 |
| write_ios       |    3 |    0.1 |
| write_merges    |    1 |   0.03 |
| write_sectors   |   16 |   0.53 |
| write_ticks     |    2 |   0.07 |
| in_flight       |    0 |    0.0 |
| io_ticks        |    4 |   0.13 |
| time_in_queue   |    2 |   0.07 |
| discard_ios     |    0 |    0.0 |
| discard_merges  |    0 |    0.0 |
| discard_sectors |    0 |    0.0 |
| discard_ticks   |    0 |    0.0 |
| flush_ios       |    0 |    0.0 |
| flush_ticks     |    0 |    0.0 |
| read_bytes      |    0 |    0.0 |
| write_bytes     | 8192 | 272.81 |
| discard_bytes   |    0 |    0.0 |
---------------------------------
OK, well, now I am very curious what these 8192 bytes are. They don’t seem to be metadata? Or maybe there is other metadata, just not access time.
Let’s regroup and sum up our observations.
- When we write 512 bytes the normal way, right after
ddexits, we see 2048 bytes getting written, and 30 seconds later, a further 20480 bytes. - When we write 512 bytes with
oflag=direct, right afterddexits, we see we see 2048 bytes getting written, and 30 seconds later, a further 20480 bytes. - When we write 512 bytes with
oflag=sync, right afterddexits, we see we see 14336 bytes getting written, and 30 seconds later, a further 8192 bytes. - When we write 512 bytes with
oflag=syncand the filesystem mounted withnoatime, right afterddexits, we see we see 14336 bytes getting written, and 30 seconds later, a further 8192 bytes.
In all cases, we write a total of 22528 bytes.
My questions are:
- What are there 8192 bytes that get written 30 seconds after
ddfinishes? - We are writing only 512 bytes, and it makes sense that this is inflated to either 2048 bytes (the block size) or 4096 (the disk sector size). I also understand that there is metadata written. Beside that, what else accounts for the total 22528 bytes?
I think I need to go back to Gregg’s disk chapter. For example, since an SSD is flash, it may not even have a cache, yet I have been talking as if it does. Also, I believe Gregg shows off some tools that can show the events on disk, which may help figure out what is happening.
First off, Gregg mentions that flash SSDs do use write-back caches. Alright, I’ll keep that in mind.
Second, he talks about how data is written to SSDs. First, you must erase a “block” of memory (not sure what a “block” is yet), and then overwrite it entirely. The “blocks” are composed of pages, which are themselves 8-64 KB. OK, here’s what a block is: it’s just referring to how many pages you write at a time. Pages are erased in blocks of 32 to 64. The controller may also emulate a hard drive block interface, with sectors of 512 or 4096 bytes. Well, that explains why I saw reference to a 4 KB “sector size” earlier.
Gregg goes on to describe what might happen in exactly our scenario (writing in very small blocks).
The write characteristics can be a problem for write workloads, especially when writing I/O sizes that are smaller than the flash memory block size (which may be as large as 512 Kbytes). This can cause write amplification, where the remainder of the block is copied elsewhere before erasure, and also latency for at least the erase-write cycle. Some flash memory drives mitigate the latency issue by providing an on-disk buffer (RAM-based) backed by a battery, so that writes can be buffered and written later, even in the event of a power failure.
Again, it sounds like my SSD could have an on-disk buffer. I’d like to confirm that. Additionally, linking way back to the whole sysbench thing, it sounds like perhaps the 16 KB chunk size is smaller than the SSD’s write block size (which might explain why the SSD appears to be writing so much when sysbench says it has very low throughput).
There is much left to read. I will continue tomorrow. Ah, wait, no I won’t. Tomorrow, all my shit is finally getting delivered from the States! Have a good weekend.
Ah, wait, one more thing!
After changing the block size to 2048:
$ sudo blockdev --getiomin --getioopt --getpbsz --getss --getbsz /dev/sda5
4096
0
4096
512
2048
So only getbsz refers to the actual file system block size.